Finding JavaScript bliss with the Chrome debugger
I'm always on the lookout for ways to make my job easier. How can I build out functionality more quickly? How can I understand my code better? How can I debug more reliably?
The best tool for doing all of this has been Google Chrome's built-in debugger. Yep, I was surprised, too -- I didn't even realize it existed for years. Since then, it's been my go-to aide for everything JavaScript.
Actual photo of someone using the Chrome debugger.
Learning how to use the Chrome debugger helps me write and debug more quickly, but more than just that, I actually understand code better. I can isolate behavior, test out ideas, and feel my way around the codebase more quickly and reliably than ever before.
It's high time to pay this forward, so here's a primer on the Chrome debugger. Hope it'll make your lives easier! 💖
The debugging landscape
So if I just found about the debugger, how have I been debugging code until now?
There are three major options for debugging frontend JavaScript. I'll run over what they are and why two of them fall short. 😈
PS, you can 100% use the Chrome debugger on backend JS as well -- check out the very end of this post. 😈😈
PPS, Safari also has a built-in debugger with a really similar feature set. I don't use Safari much, though, so I'll let someone else write that blog post 😈😈😈
alert(): not even once
alert(value); pops up a browser-level modal containing value. It’s often the first debugging method taught to JS newbies; it’s concise, easy to understand, and provides immediate feedback. Unfortunately, it’s a terrible debugging utility and you shouldn’t use it.
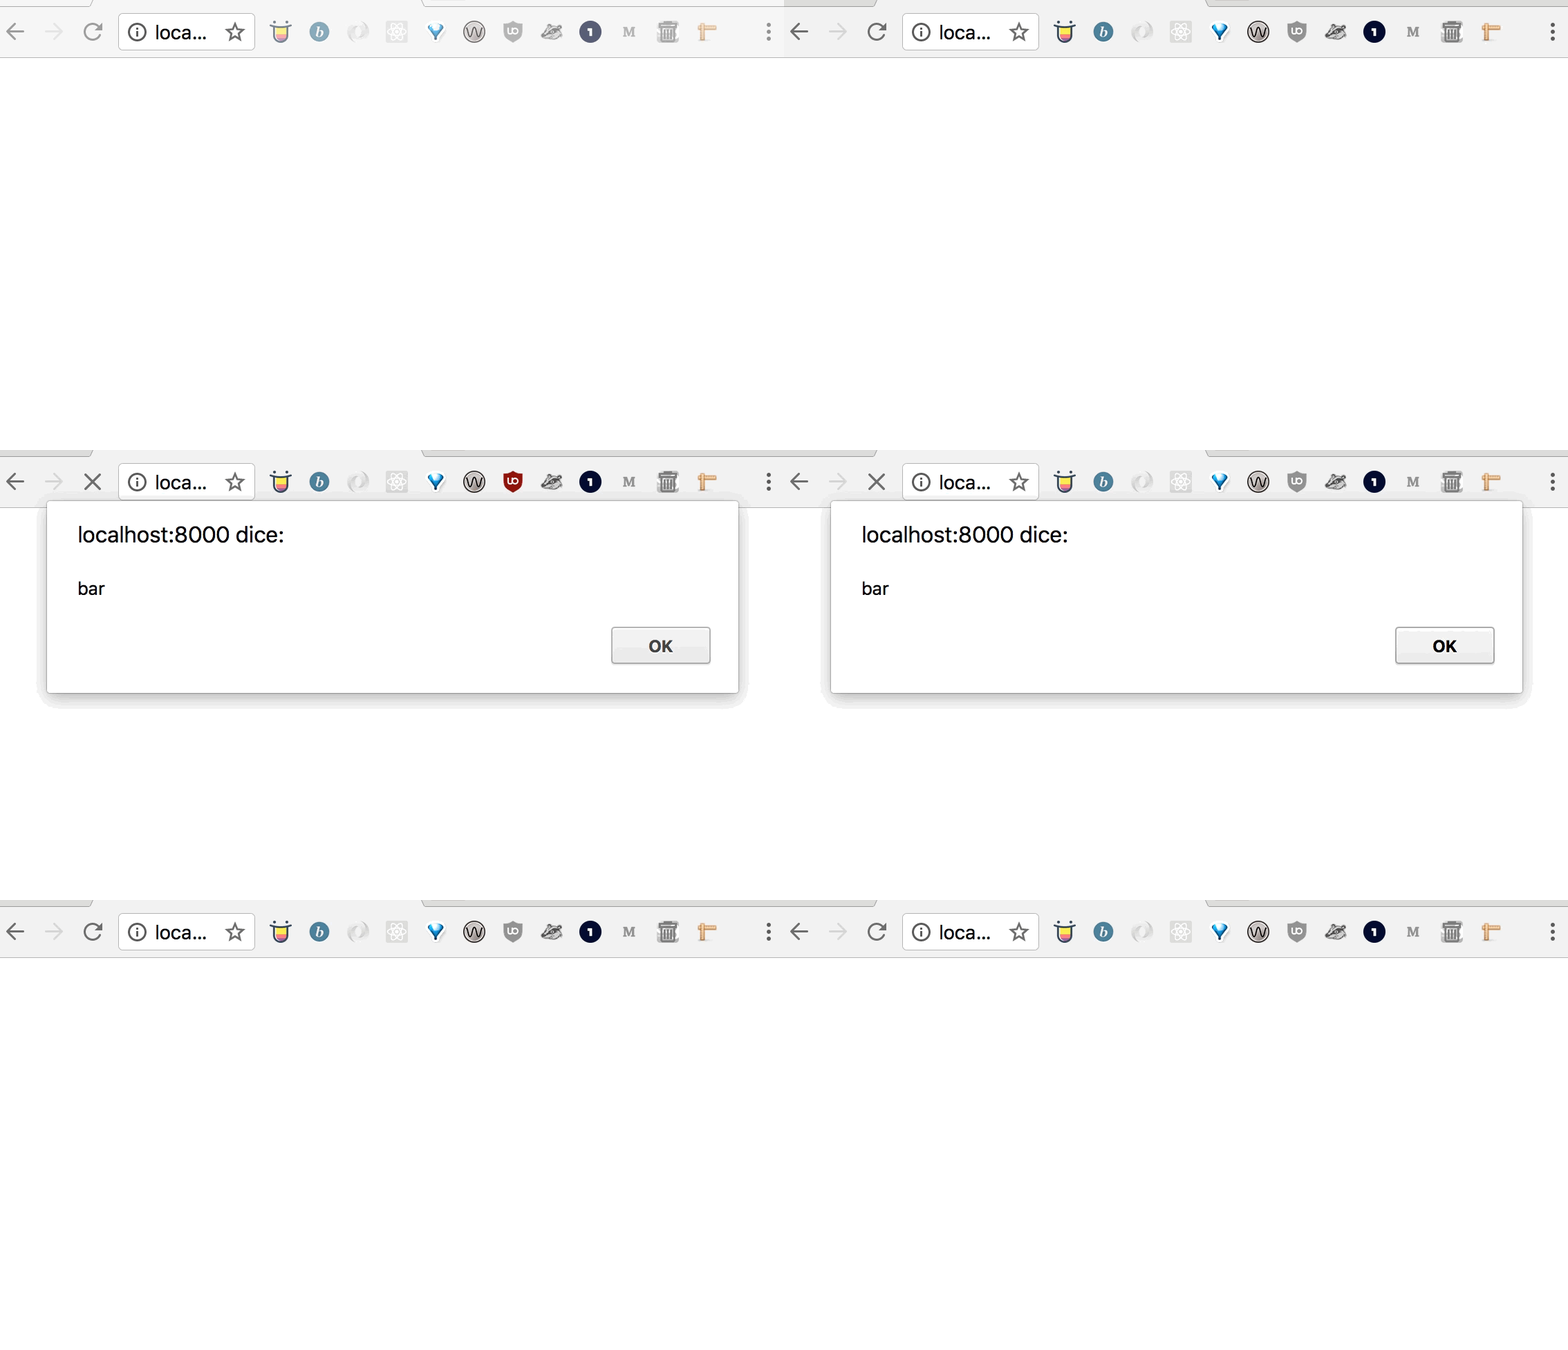
const foo = 'bar';
alert(foo);
Here are some reasons to stop using alert():
It doesn’t support our debugging needs.
alert()isn’t content-agnostic and it can only output certain data types. For example, if you try to print anObject, the alert will show the monumentally unhelpfulobject Object. You can print out the actual contents of the Object by converting it to a String first, but this is a clear indication thatalertsaren’t prepared to offer what we need from them.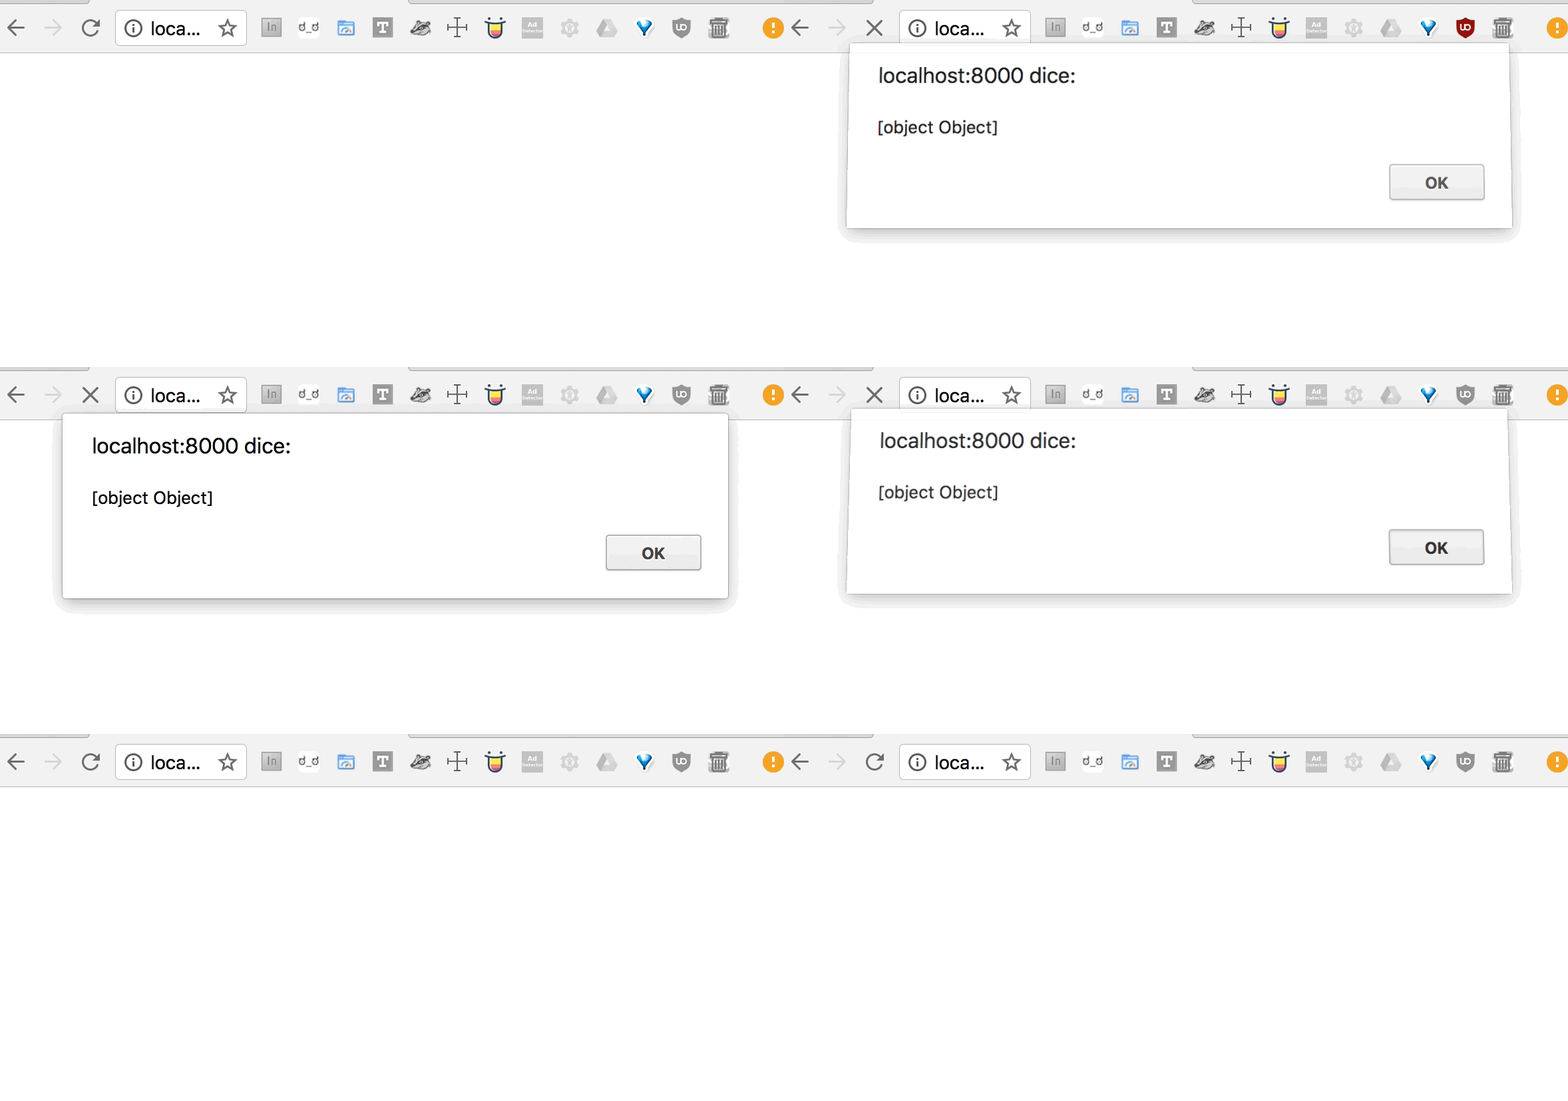
IT BURNS US PRECIOUS
It doesn’t include contextual information.
alerts don’t by default include the line number or file name of where thatalertwas created. This puts the onus on you to manually include identifying information in your alert messages if you’re usingalertin multiple places.Any alerts left in production code will create visible, disruptive popups for all users. Enough said.
Alerts can cause unintended side effects. Alerts are thread-blocking, so nothing else will happen while one is open. Your page will halt loading; animations will pause (but may jump ahead upon closing an alert, depending on how they're implemented). You need service workers to get around this threading issue, and those service workers could be used to solve much cooler problems.
console.log(): you could do better
You also have the much more helpful (but not amazing! keep reading) option of printing information to the console available in Chrome’s DevTools using console.log(value).
Console fills in a lot of the gaps that alert lacks, such as line numbers and filenames. It's also much more robust: you can log Objects directly without having to coerce them into Strings, and you can drill down into Objects and Arrays to inspect their contents. You can even get fancy and indicate importance with different log levels, such as console.warn() and console.error() 💅
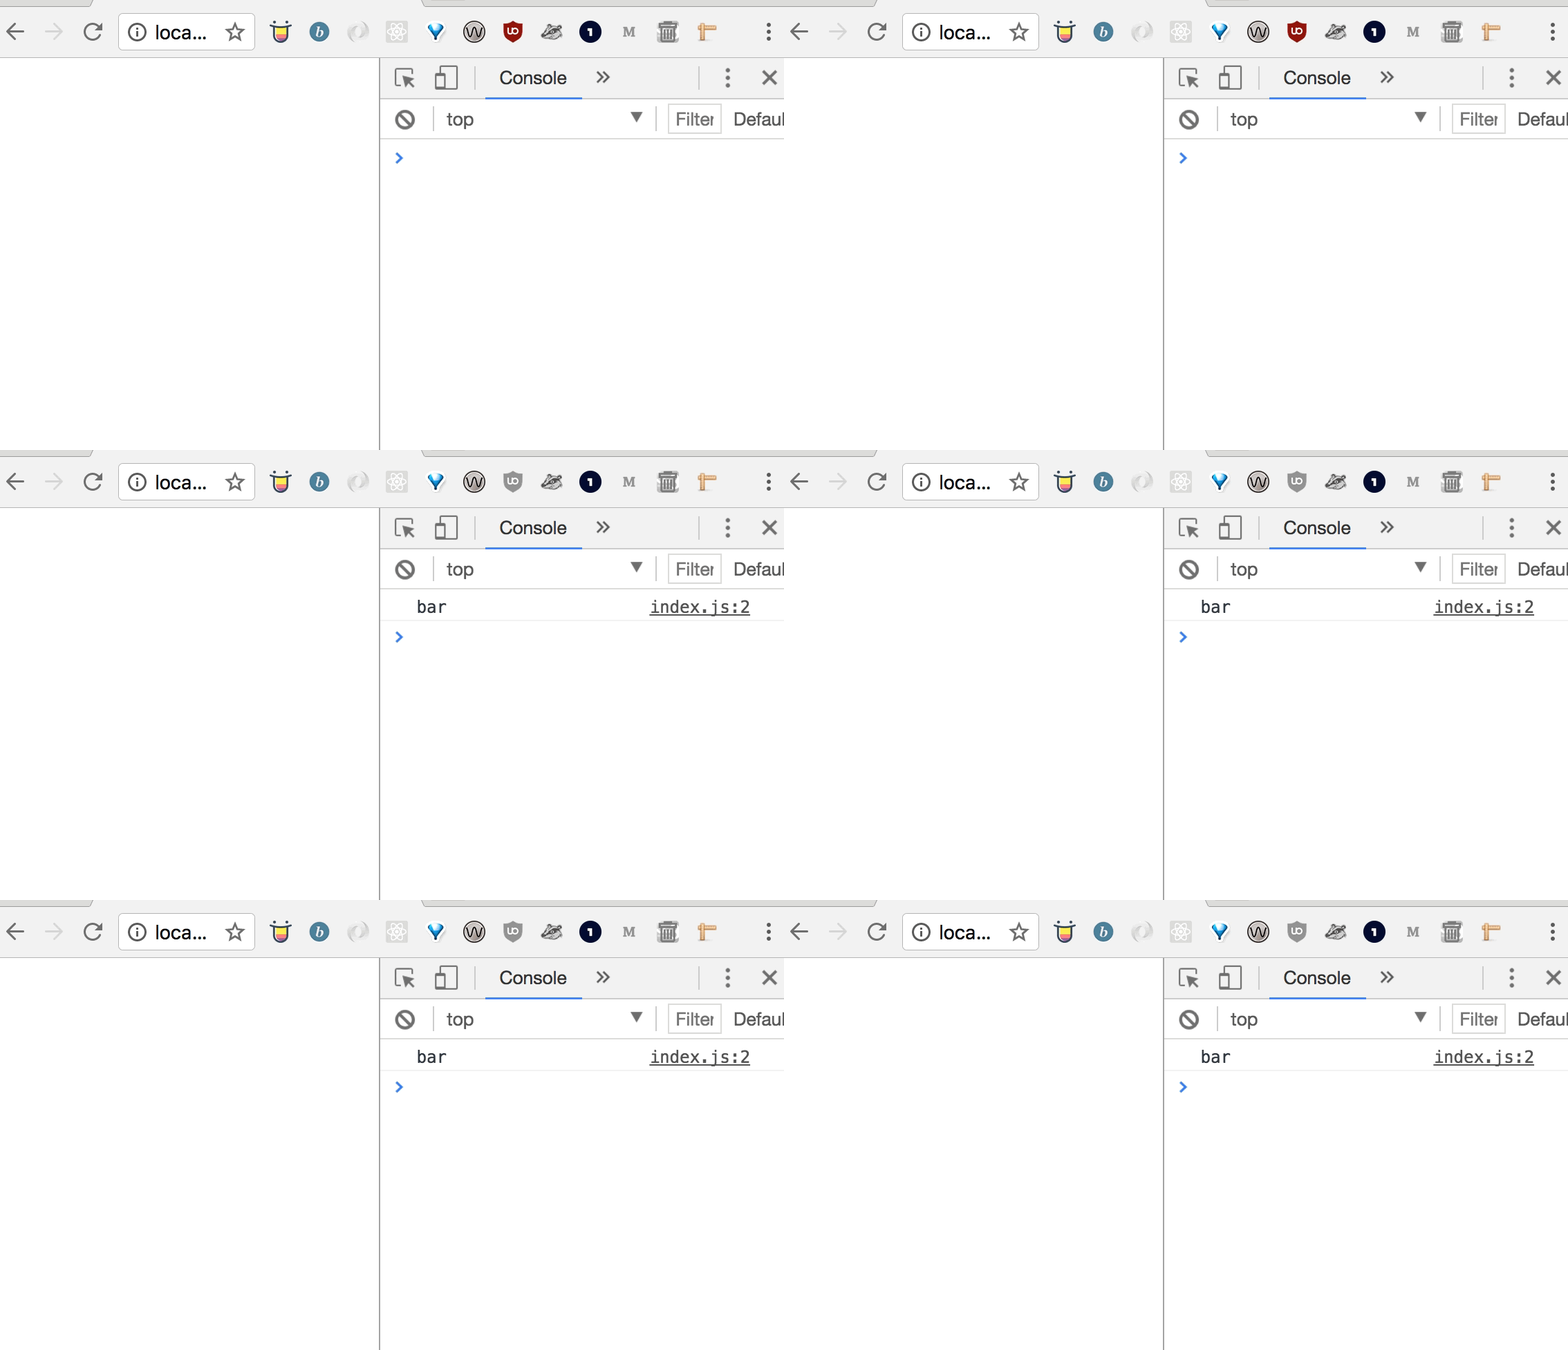
const foo = 'bar';
console.log(foo);
Console messages should also be removed in production, but at least they will only be visible to visitors who have their consoles open; i.e., other nerds. Also unlike alerts, they will completely break your site for IE9 users. IE9 and below have a console that only exists while DevTools is open, so any errant consoles left in production will nuke those users’ JS.
Console is way more helpful than alert, but it still falls short in complex situations. There are abundant StackOverflow questions, such as this one, stemming from difficulties getting Console to accurately report changing values. Similar to how [object Object] shows that alert() isn't built to address certain needs, this issue with the console suggests that console isn't enough for us, either.
Console can also get confusing if you’re trying to dig into a large object or set of objects due to the sheer amount of output that you receive. It can be overwhelming to use console to monitor an animation on requestAnimationFrame or track down a value change in a mobx store.
Console is an essential tool for frontend developers, and it’s a huge step up from Alert, but it’s not the answer to everything. To supercharge your debugging powers, let’s turn to…
Interactive debugging: happily ever after
Interactive debugging using Chrome's debugger is a vastly different tool than Console or Alert. While the latter two are limited to printing out specific values, interactive debugging lets you roam around your code while accessing all the values in scope at that point in time.
Another actual photo of someone using the Chrome debugger.
You don't even have to write any code for this one. All you need is to open Chrome's DevTools via Cmd+Option+I or View > Developer > Developer Tools and then click on the Sources tab.
Okay, ready?
Let's get debugging
Chrome’s interactive debugging tools work on any JavaScript, but they’re most helpful if your code has not been uglified, minified, concatenated, or obfuscated.
These are project-by-project (maybe even file-by-file) configurations. You may have to make development vs. production webpack configs; you may already be good to go.
Meet the Sources tab
All your debugging tools live in Chrome’s Sources tab. Open this via the menu options View > Developer > Developer Tools or pressing Cmd+Option+I and then clicking to view the Sources section. The panel that opens should look something like this:
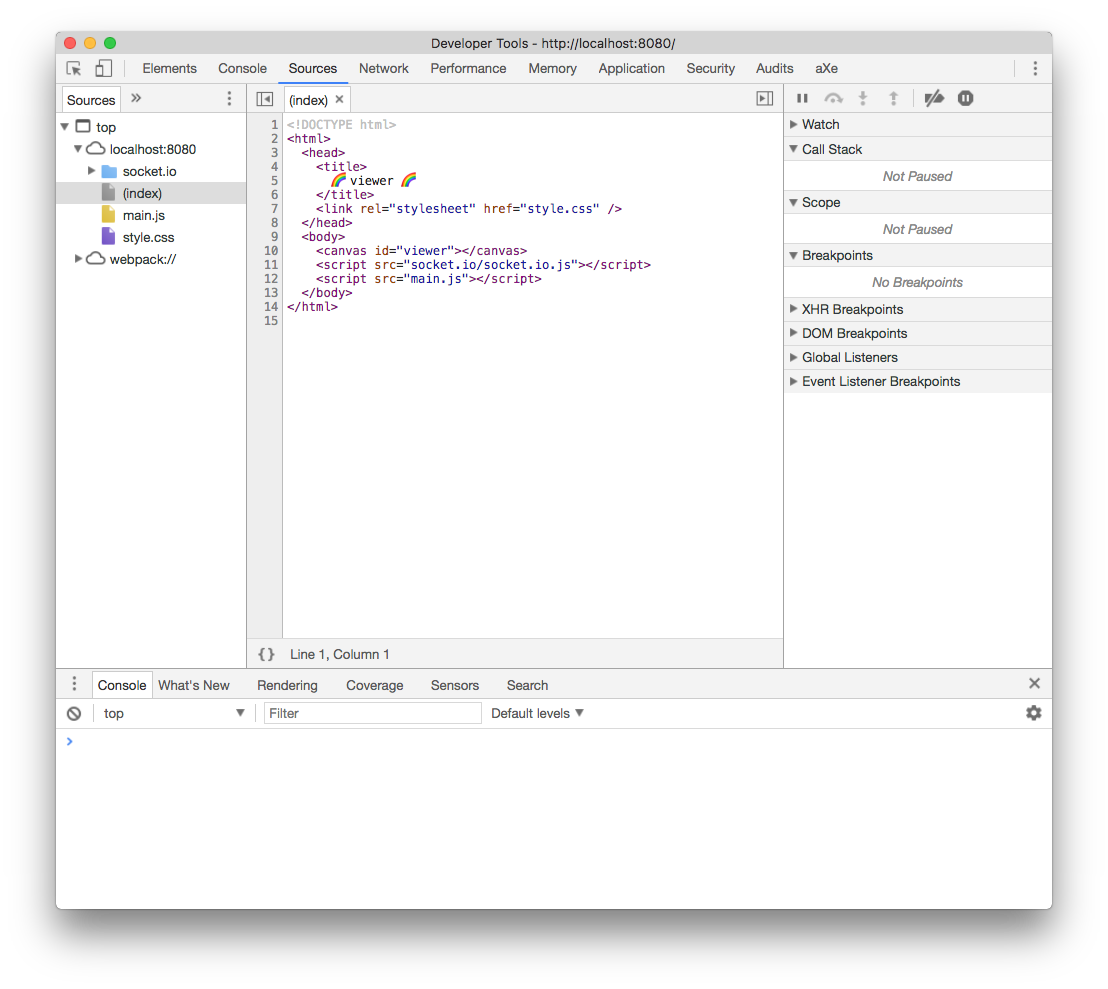
Yep, that's kind of a lot at once. I don't even use everything in here. But it's really easy to use once you know what to look for.
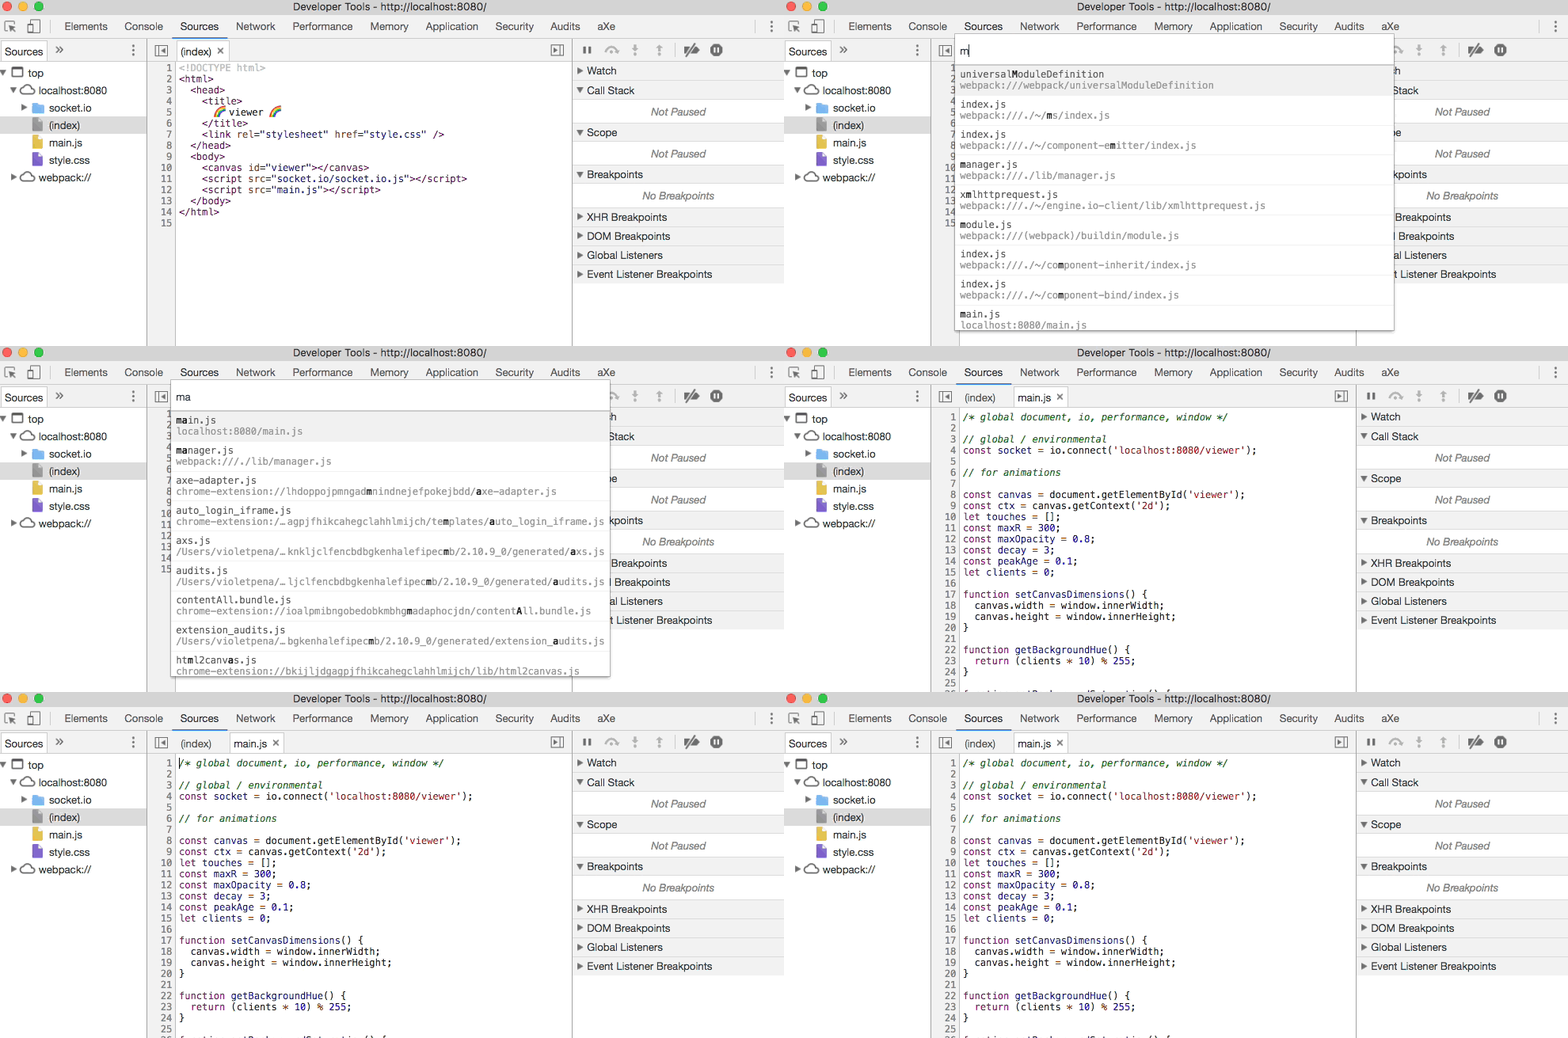
Fuzzy finder activate!
While focused inside the Sources tab, you can open a specific file by pressing Cmd + P to open the fuzzy finder. Start typing with this open to target a specific JS file that you want to poke around in.
Setting breakpoints
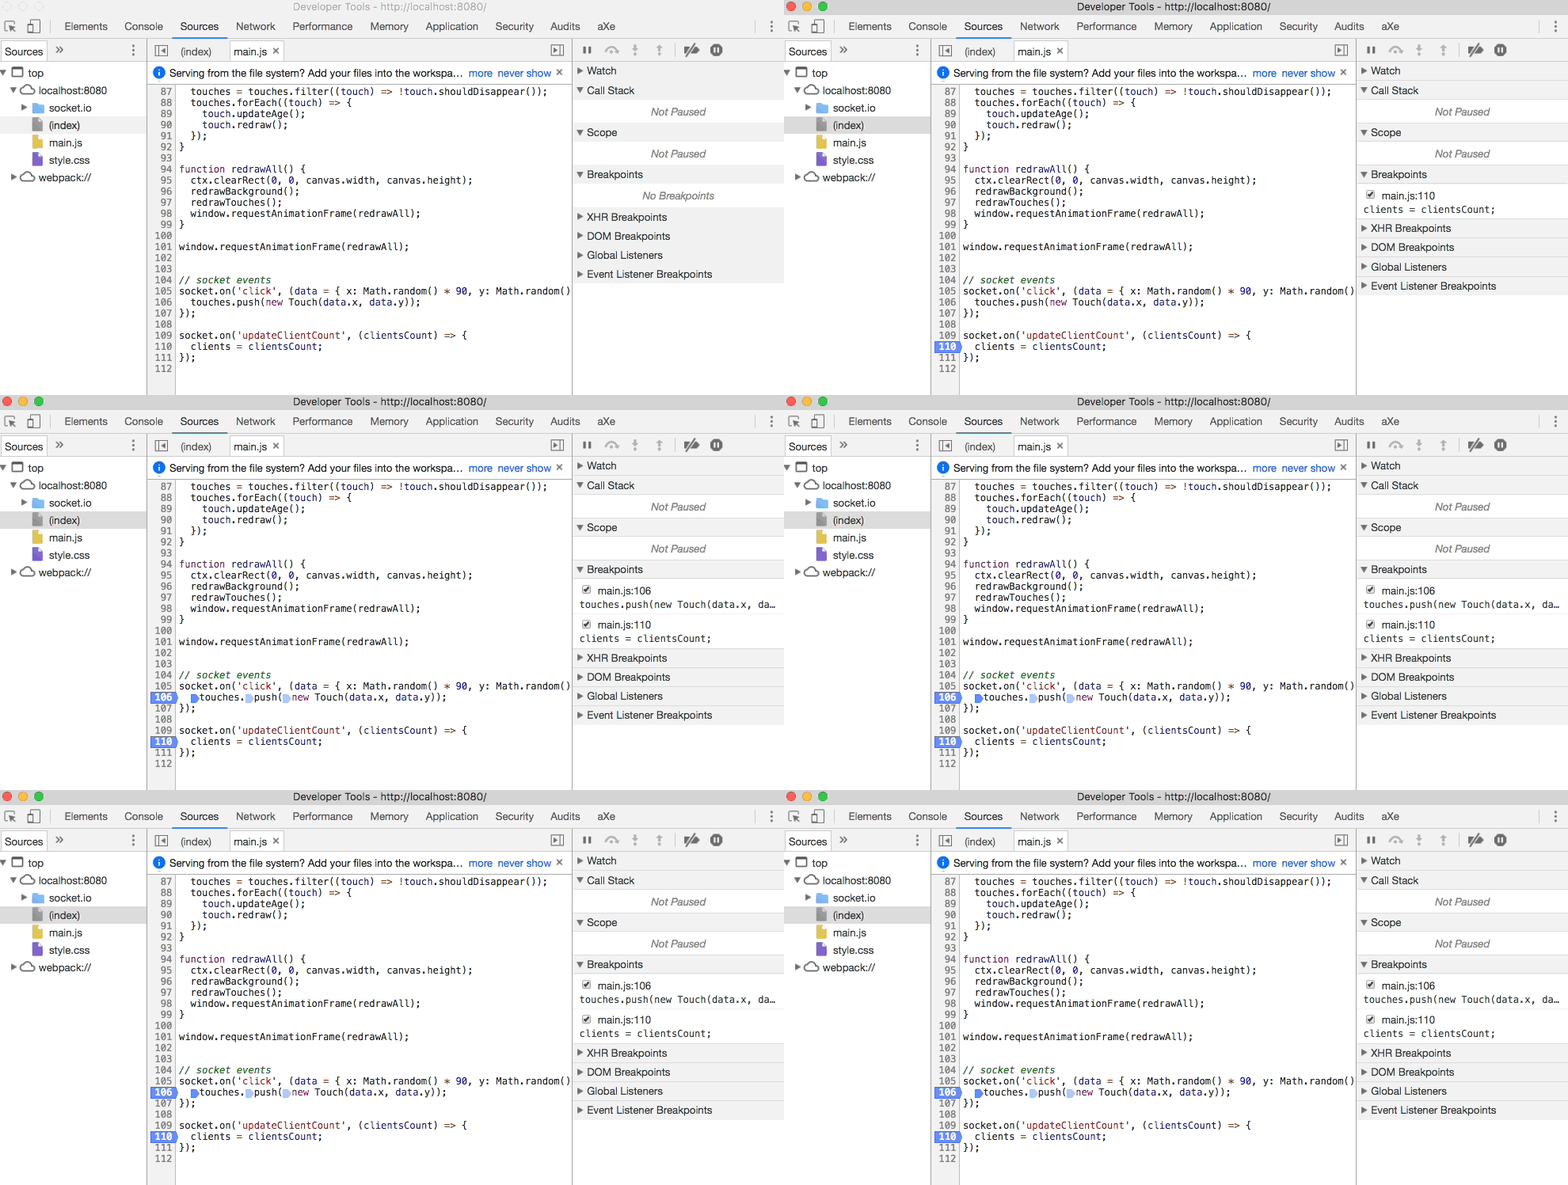
All your power in the debugger comes from setting up breakpoints in your code. These are little flags that you drop down to pause execution of JavaScript.
You make a breakpoint by clicking in the left margin next to a line of code; you can remove breakpoints in the same way. Notice that breakpoints appear in a master list as well as being marked in their home file.
So if you drop a breakpoint in some code that executes when the document is ready and then refresh, that breakpoint gets hit, your code stops, and a scrim drops over your viewport.
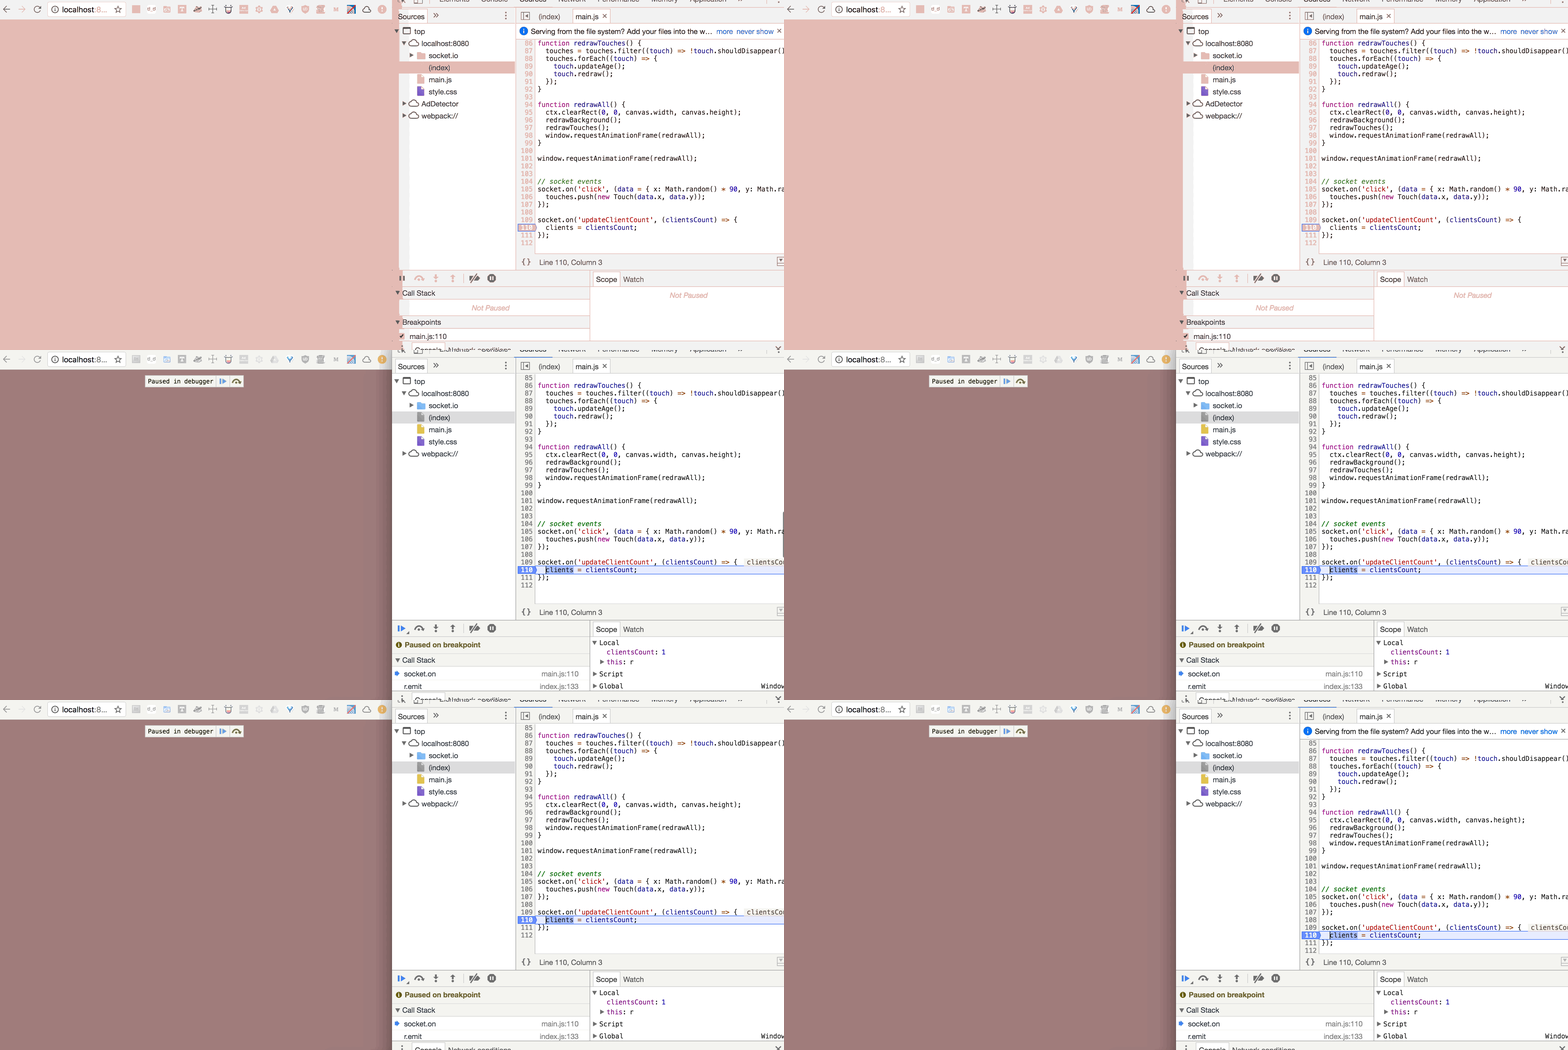
Doesn’t sound too exciting, but trust me, it gets pretty amazing…
Inspecting values
While you’re halted at a breakpoint, your debugger has access to all variables currently in scope. You can inspect these values in three ways:
hover over that variable and a tooltip will show up:
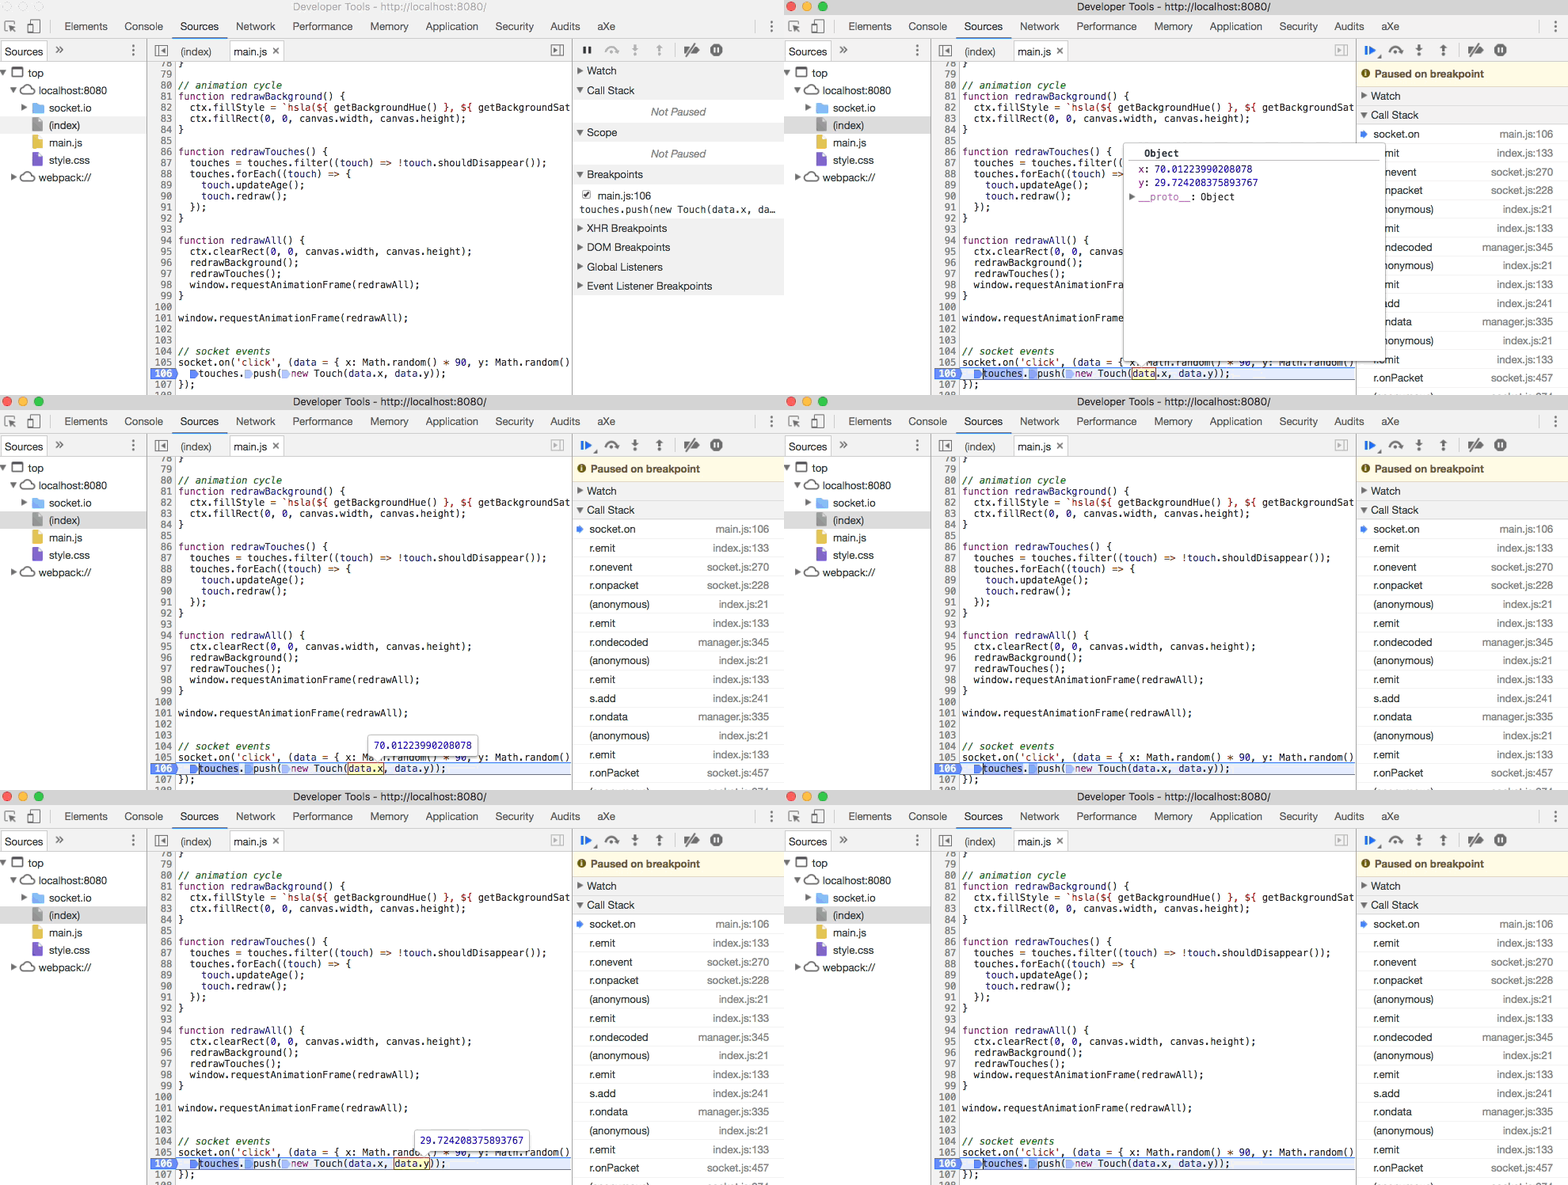
This is a super lightweight, immediate way to view variables on the fly.
type that variable name in your console and hit
Enter.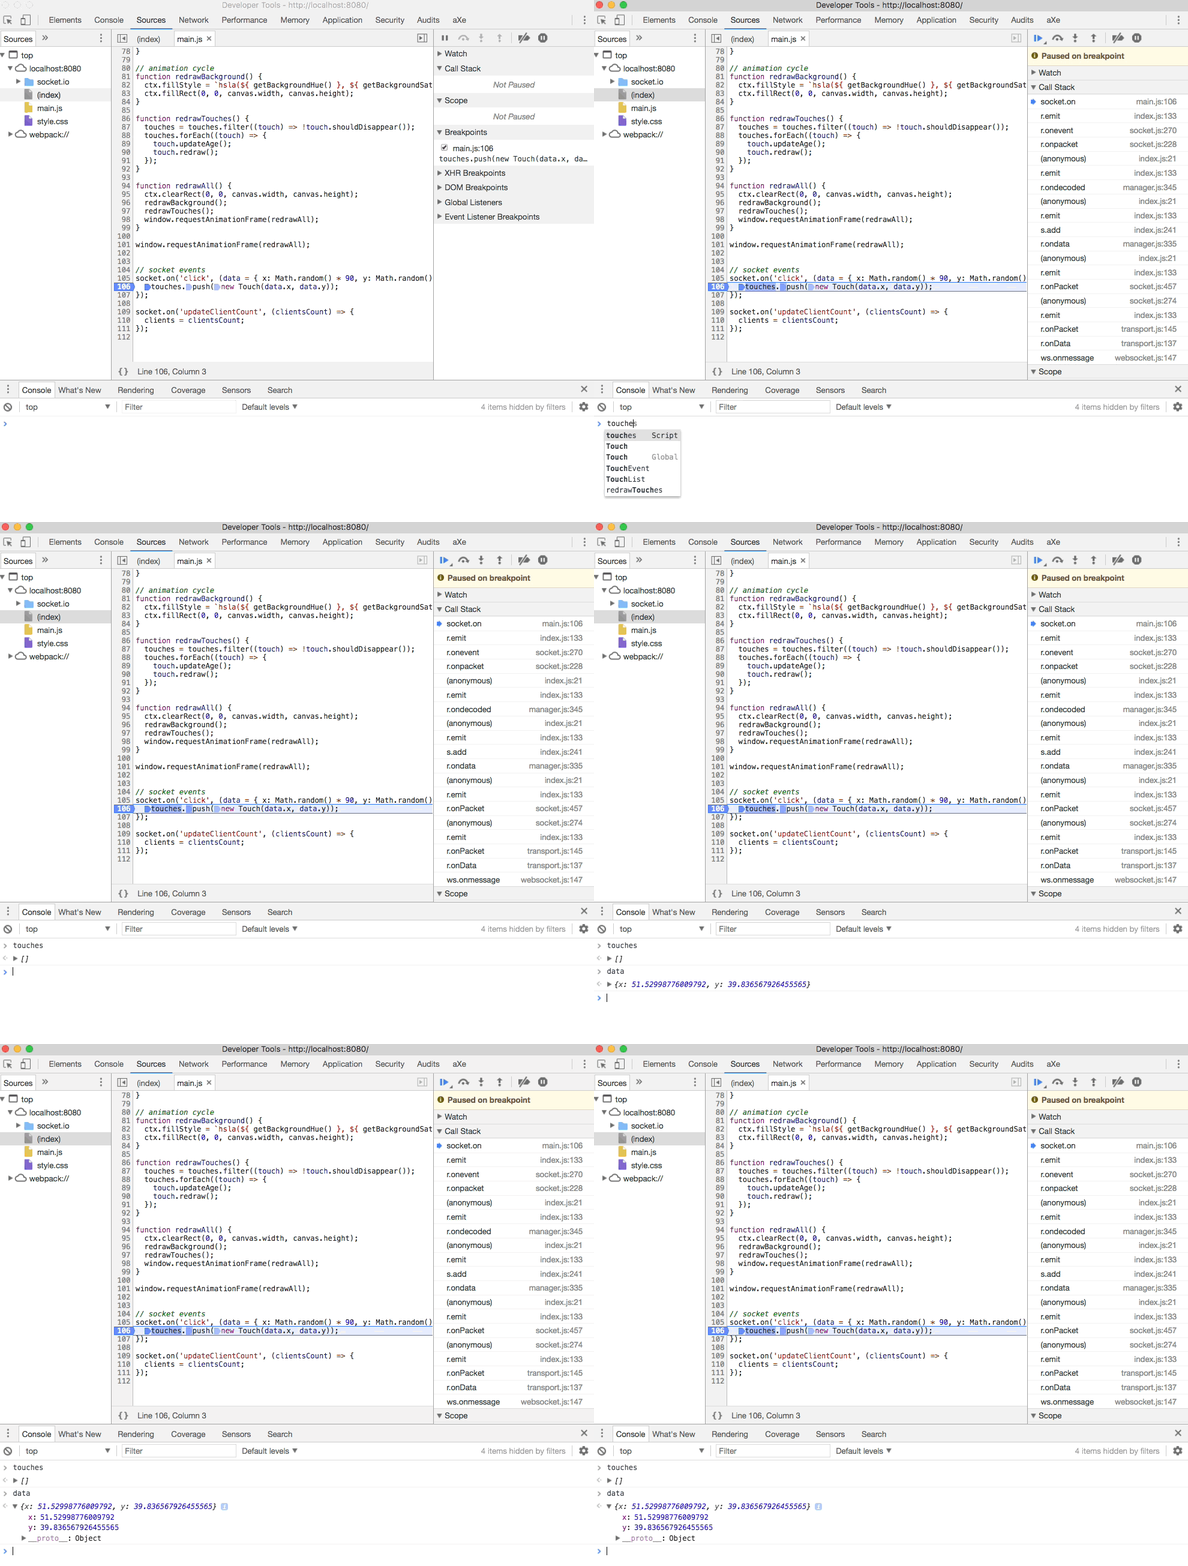
This will feel the most familiar for fans of
console.log(), but in this case you don't have to wait for your code to recompile 🥂find that variable in the
Scopepane of the Sources panel.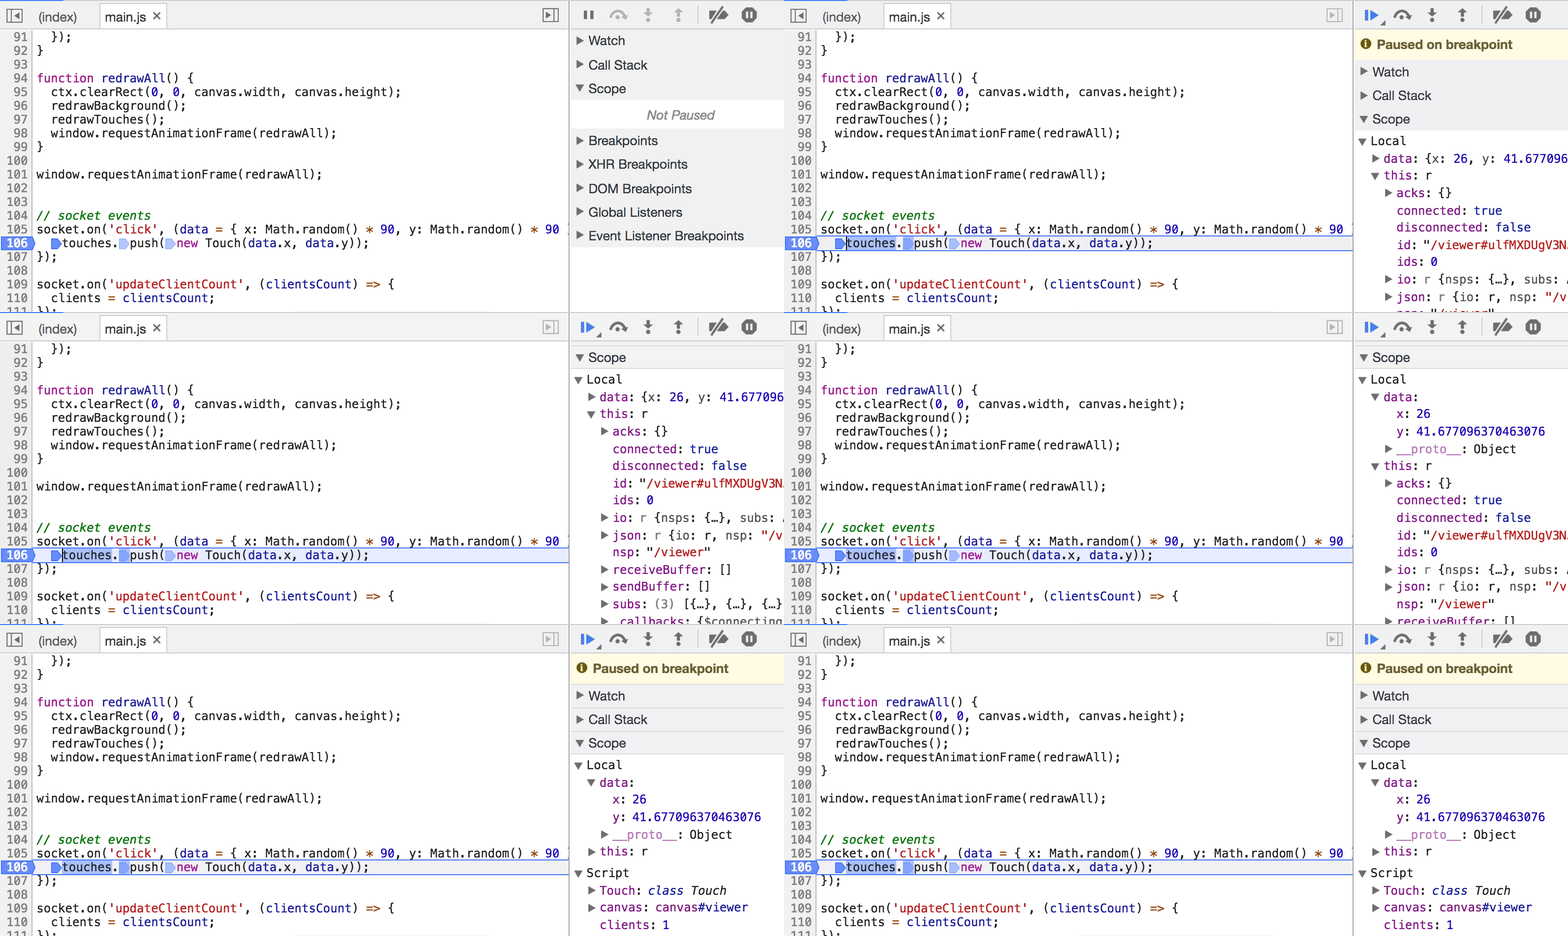
This pane can feel buried under the
Call Stackpane, but it's the most comprehensive option of the three. It shows you all variables currently in scope, including global values that you might not even remember setting.
Moving around
You aren’t limited, however, to inspecting exactly around the breakpoints you set. The last major part of interactive debugging is this row of buttons:
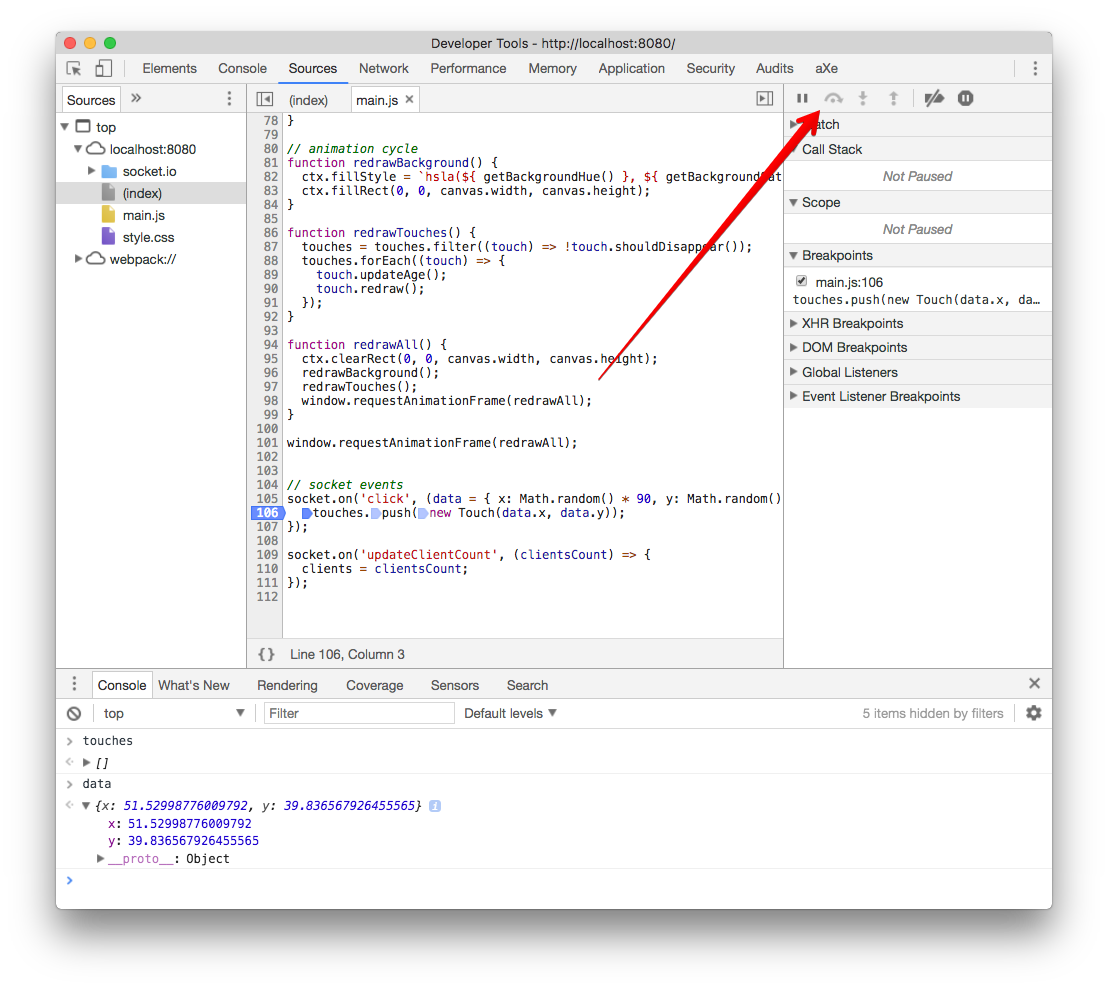
These buttons let you walk around across functions and files while keeping your inspector powers. Being able to do this is invaluable, but it can feel confusing or overwhelming, especially if you’re dealing with a lot of third-party code. Here’s what each of the buttons mean, and when you might want to use them:
- Play/pause: Start or stop script execution. This is how you start executing script again from inside a breakpoint.
- Step over: Execute the current line of code and pause on the next line. This is great for when you need to track what’s happening inside of a specific function, or what happens to a value on a line-by-line basis.
- Step in: Dive into the body of the current function call and pause on the first line of that function. This lets you inspect the inner workings of a function, as opposed to step over, which will execute the entire function without pausing.
- Step out: Finish executing the current function body and pause on the line that called it. This is the opposite of step in and is useful when you want to see where your current function was called from or you don’t want to have to step over every line of the function in order to see where it is applied.
You can use these movement options to track values across files, investigate individual values every time a function is called, etc. They’re incredibly useful and my best advice/non-advice is to play around with them until you develop a sense of how they behave and when to use them.
Next to these buttons is a button to disable all breakpoints; this button lets you “mute” all current breakpoints without actually deleting (and potentially having to re-add) them.
Debugging best practices
Apart from being absurdly useful, one advantage of using the debugger as your sole logging/debugging tool is that all the stuff you’re adding only exists for you. Debugging hooks shouldn't be a part of production code and the Chrome debugger makes it very easy to make sure this happens.
That said, you also have the option of inserting a breakpoint into your actual code. Put a line in your JS that says debugger; and when the browser reaches that line, it’ll pause and then you can poke around and inspect values as described.
Don’t do this. I’m talking about it for completeness’ sake, but it’s not a good idea. (Full disclosure: before I knew that the debugger had a fuzzy finder, I used this a. lot.) Manually putting debuggers in your code introduces a bunch of the problems inherent to Alert and Console, and while breakpoints aren't visible to users who don't have DevTools open, a full-window takeover looks way more terrifying than a line of console text.
Debugging is better when a) it’s local; and b) it doesn’t require writing any code. If for some reason you need to actually code in debuggers (or consoles or alerts 😬), look into making production vs. development configurations for your linter, and have it refuse to build if it finds any of that in an attempted production build.
tl;dr
You should start using the Chrome debugger today because:
- Interactive debugging will help you work faster. I’ve lost way too much time including a typo in my
console.logs, or straight up logging something incorrect or unhelpful. The Chrome debugger lets you inspect code arbitrarily, which means less guessing, coding, refreshing, and waiting. - Interactive debugging will help you understand your code. Having the power to dive into your work on a line-by-line basis helps you understand not only what happens to specific values but how your entire project fits together.
- Interactive debugging will prepare you for other programming environments. My intro to interactive debugging didn’t involve Chrome but Xcode, during that strange year that I was a web/iOS developer. If you're a frontend developer and might potentially want to do any other kind of programming, being familiar with interactive debugging will be massively helpful.
Getting comfortable with the Chrome debugger made me a much happier developer, and I really don’t know how I survived without it 😭 Start playing around with it ASAP — it may be overwhelming at first, but keep with it and it’ll swiftly become your preferred way to work.
Parting thoughts
I have a few more thoughts on the Chrome debugger that didn't fit in the main narrative of this post, so enjoy:
The learning curve
There is absolutely a learning curve to using the Chrome debugger. You'll have to do a lot of playing around with setting breakpoints and inspecting code, but as you work, keep asking yourself:
- is this line of code actually executed by the browser?
- is this variable in scope right now?
You may have trouble if the answer to either of these questions is "no".
Going deeper
I didn't cover everything that you can do with the debugger. You should take your time to read more on it and play around with it. One fab thing, which you may have already guessed is possible, is that you can actually change the value of local variables while on a breakpoint with that variable in scope. Set its value to whatever you want in the console.
My point is, the debugger is amazing. Keep poking around and you'll find even more cool stuff!
Backend JS debugging
As of May 2016, you can freakin debug your Node.js code in Chrome. Paul Irish did a lovely writeup on how to get this going. 🚀
Okay okay I'm done now. Happy coding!